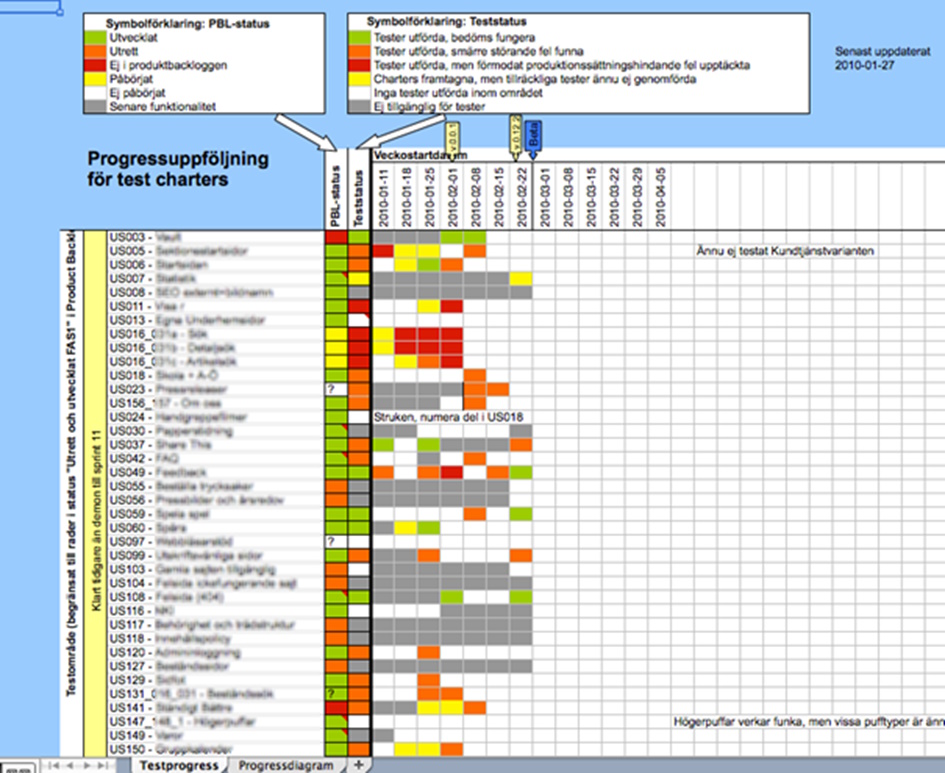
Follow-up chart for test sessions in Session based Testing
When testing in session based testing (SBT) it may be hard to keep track of test progress.
This chart is something I've used during these circumstances to mitigate risk. When you never have time for full regression test, test charters is an afficient method of testing.
However, using risk based testing one of the risks is that something stopped working without you noticing. I used the chart (and template) below to assess how long time it was since I last ran a specific test charter.

As may be seen we used one charter for each user story.
One noticable thing with the column is that there are two different columns for status. One is for the status the developer claims for the feature, the other is for the status the tester claim for the feature. This was useful for reporting to the steering committee.

To use it, just download it through the link below.
Note that it is an Excel based chart - and that there is an example on a separate (deletable) tab.
Download link