JMeter tricks
2023-06-09
JMeter is an Open Source tool for load generation. It support multiple protocols and technologies, but is probably most used to generate traffic over HTTP and HTTPS for load tests, stress tests, and performance analysises.
If you are used to the performance testing tools of major vendors the approach of JMeter will strike you as a bit cumbersome, but hey; it's free and competent once you gotten the hang of it.
The first times I used JMeter I found it hard to use, but the more I got the hang of it the more I apprechiate the tool.
Installing JMeter and getting it to run
It's easy to install JMeter.
Download the installation archive from Apache JMeter.
Unzip and place all the folders in the same catalogue and double click the jmeter.bat file and you should get the GUI started.
Fastest approach - recording a HTTP request sequence to multiply
We need to do some configuration for first run with JMeter recorder. Almost all of these steps are only needed for the very first recording since the certificate is already installed and your browser probably has stored your alternative LAN/proxy settings for easy access.
Set up somewhere to store recorded HTTP(S) transactions
We need somewhere where the recorded transactions end up, not to confuse them with other stuff in our JMeter Test Plan. It's almost always a good idea to create a specific Thread Group for each time we record transactions.
- Start JMeter by invoking the jmeter.bat of the bin folder. You should soon see the JMeter GUI.
- Right-click Test Plan in the left pane to choose Add->Threads (Users)->Thread Group.
-
Right-click the new Thread Group and choose Add->Logic controllers->Recording controller.
Soon we'll setup this Recording Controler to be the target for recorded transactions.
Set up the Recorder for first use
JMeter records transactions by the use of a pass-through proxy mechanism. The recording proxy listens on a IP port of your choice and evaluates the traffic passing through it for recording.
-
Right-click Test Plan in left pane to choose Add->Non-test elements->HTTP(S) Script recorder.
This element is the one we'll use for recording. -
Focus the new HTTP(S) Script recorder element in the Test Plan tree view by clicking it.
In the right pane: Make a note of the port number (defaults to8888). - Choose a specific Recoring target by choosing the Thread Group->Recording Controler you created in previous step.
Setup your web browser to tunnel traffic through the JMeter recording proxy
To be able to intercept the transactions from the web browser we need to configure the traffic from the web browser to be tunneled through the JMeter Script Recorder. This is done by re-configuring the web browser to use the JMeter proxy. If you are behind a corporate proxy you might need to review the hints above.
-
Re-configure your web browser proxy settings to tunnel the communication through the recording proxy (
localhost/127.0.0.1port8888, or whatever port you set in the step above).
Configure a local SSL certificate to enable HTTPS
Most web sites uses HTTPS rather than HTTP for security reasons. When JMeter intercepts HTTPS traffic it need the JMeter recording proxy to appear as a web server to the web browser, hence needing to terminate the SSL and reconnecting with SSL, but with its own certificate. This temporary certificate is created at first run, but the web browser need to be configured to accept the certifcate as a trusted one.
- In JMeter, click the HTTP(S) Test Script Recorder and click the Start button.
-
If it's the first time you are running the HTTP(S) Test Script Recorder a certificate is now created in the jmeter/bin folder.
It has a name with the phrase
temporary
in it and only has a life span of a few days. For script setups you expect to take longer there is a setting in one of the properties files in the jmeter/bin folder to adjust the life span of this certificate - or simply remove it and JMeter will create a new one upon next run. -
Install the certificate in the web browser (Settings->Certificates->Import). Don't forget to check the checkbox for
Use this certificate to identify web sites
.
Record your script
When we record a script all HTTP related transactions are passed through the proxy, but there are a lot of settings to be made to limit the appeared complexity.
- Perform your test sequence in the web browser. Note that the resources appear in the Recording Controller in JMeter.
- Click the Stop button in the JMeter recording popup window.
Restore your browser
This optional step is sometimes forgotten, and sometimes it's frustrating to troubleshoot your Internet connection for a while before remembering you've changed your browser connection settings. It's good practice to reset it immediately to avoid this confusion.
- Set your browser proxy settings back to their initial settings so you don't forget that later.
Parameterizing and correlation
The tricky part of preparing load tests is always making sure the transactions run smoothly. You could parameterize for example login information, or correlate session ids from any response to be used in sub-sequent requests.
JMeter has some really good features for correlation and parameterization, for example the possibility to search through all transactions for specific strings, even with regular expressions matching.
Beware: Many web sites send HTTP status code 200 even upon errors, so check the response body in the Result Tree, or add a general (at Test Plan level) Response Assertion for response not containing the word error
or any other warning notice you could think of.
You may disable or remove this assertion when happy with the script.
Load configuration
Load generation in JMeter is done through using different Thread groups
for different load behaviours, and then combining these with Think Time
elements.
There are a range of different type of think times. Read up on them and use the one you favor.
Script execution
You should not execute scripts for a load test from the GUI of JMeter, but you could use the GUI to test your scripts wile developing them. Use the command line instead for when it's time for proper load tests. Check the arguments and run.
- In JMeter, click the Thread Group and set your desired number of concurrent users (Number of Threads) and the ramp-up time.
-
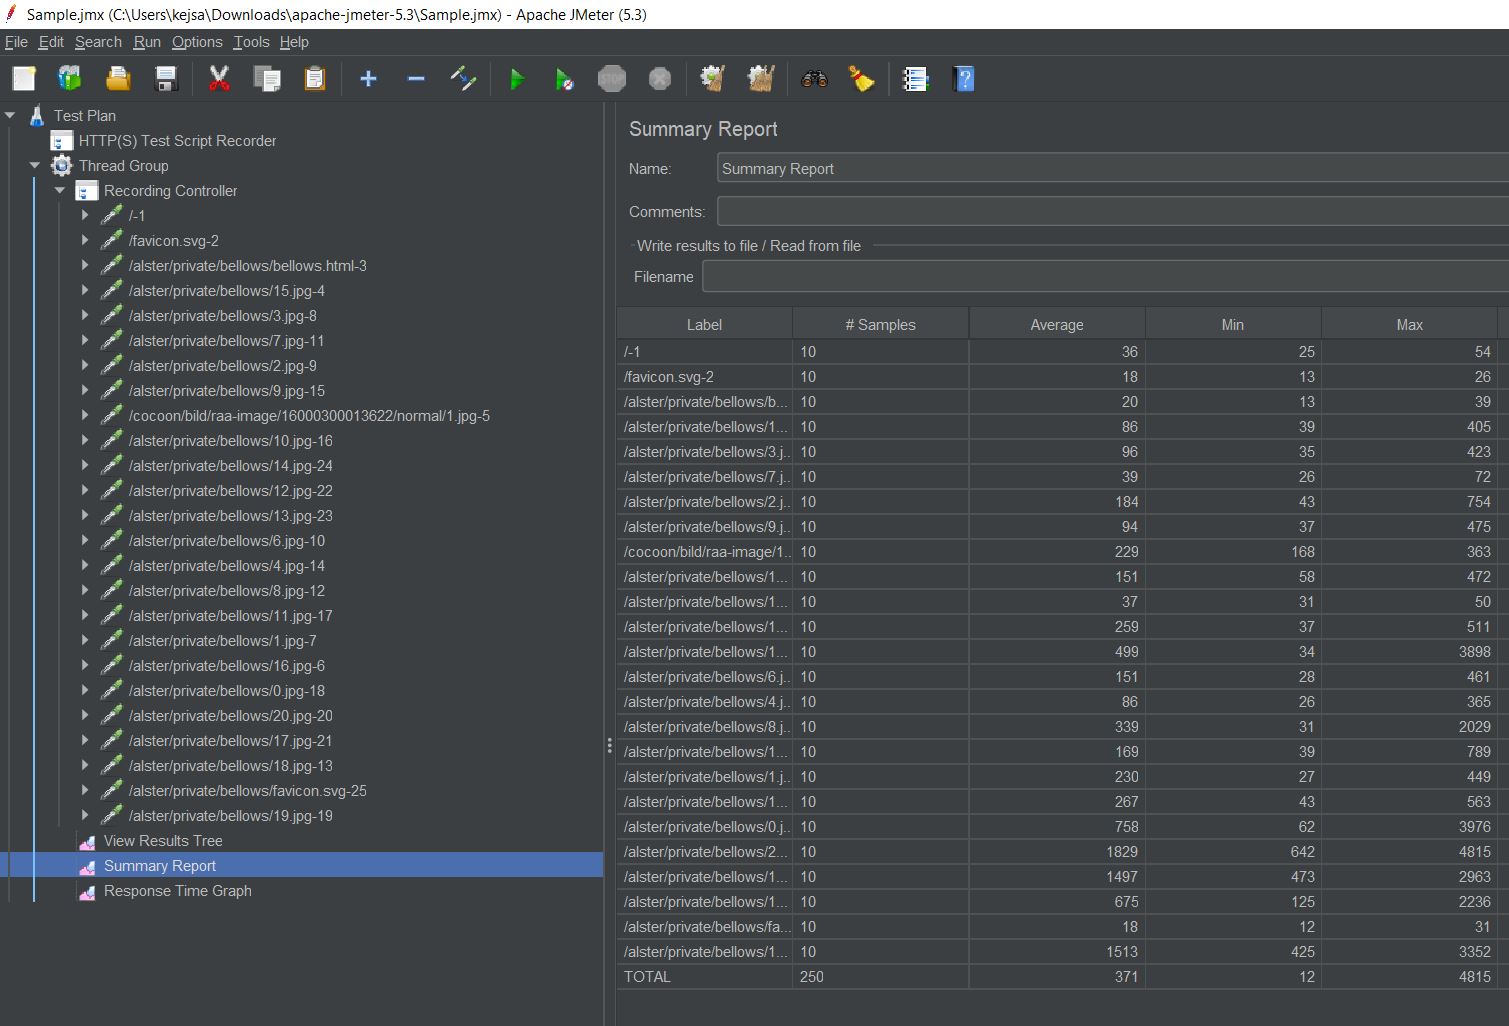
Right-click your Thread Group and add some listeners to view results:
- Add->Listeners->Summary Report
- Add->Listeners->View Results Tree
- Add->Listeners->Response Time Graph
- Save your Test Plan and press the Play button in JMeter ribbon menu to start execute your test.
- Monitor your test while it is running by clicking the different listeners.
- Don't forget to check that your load generator isn't the bottleneck. Check both the RAM/CPU/IO utilization, but also JRE usage since a JRE won't use more than it's given memory.